Platform · 05 Investigate

Your queue starts where
tier-2 usually ends.

Signals are scored, associated, and investigated before a human sees them. What reaches your team is a qualified incident: what happened, to whom, in what order, what was checked, and what to do about it.

Entity-aware by construction.

Qvasir resolves events to the entities behind them — users, hosts, processes, services — and reasons about behavior per entity over time. This is the stage that picks up what correlation escalates: everything before it is deterministic, and everything after it is an investigation.

  • Time-window scoring — related signals accumulate against an entity across a window, so distributed activity converges into one picture instead of ten disconnected alerts.
  • Entity history in every decision — how long Qvasir has known an entity, and everything it has seen it do, informs every signal and is available to every investigation agent.
  • Association, not duplication — new signals join the incident they belong to; analysts see one incident, not a feed of near-duplicates.
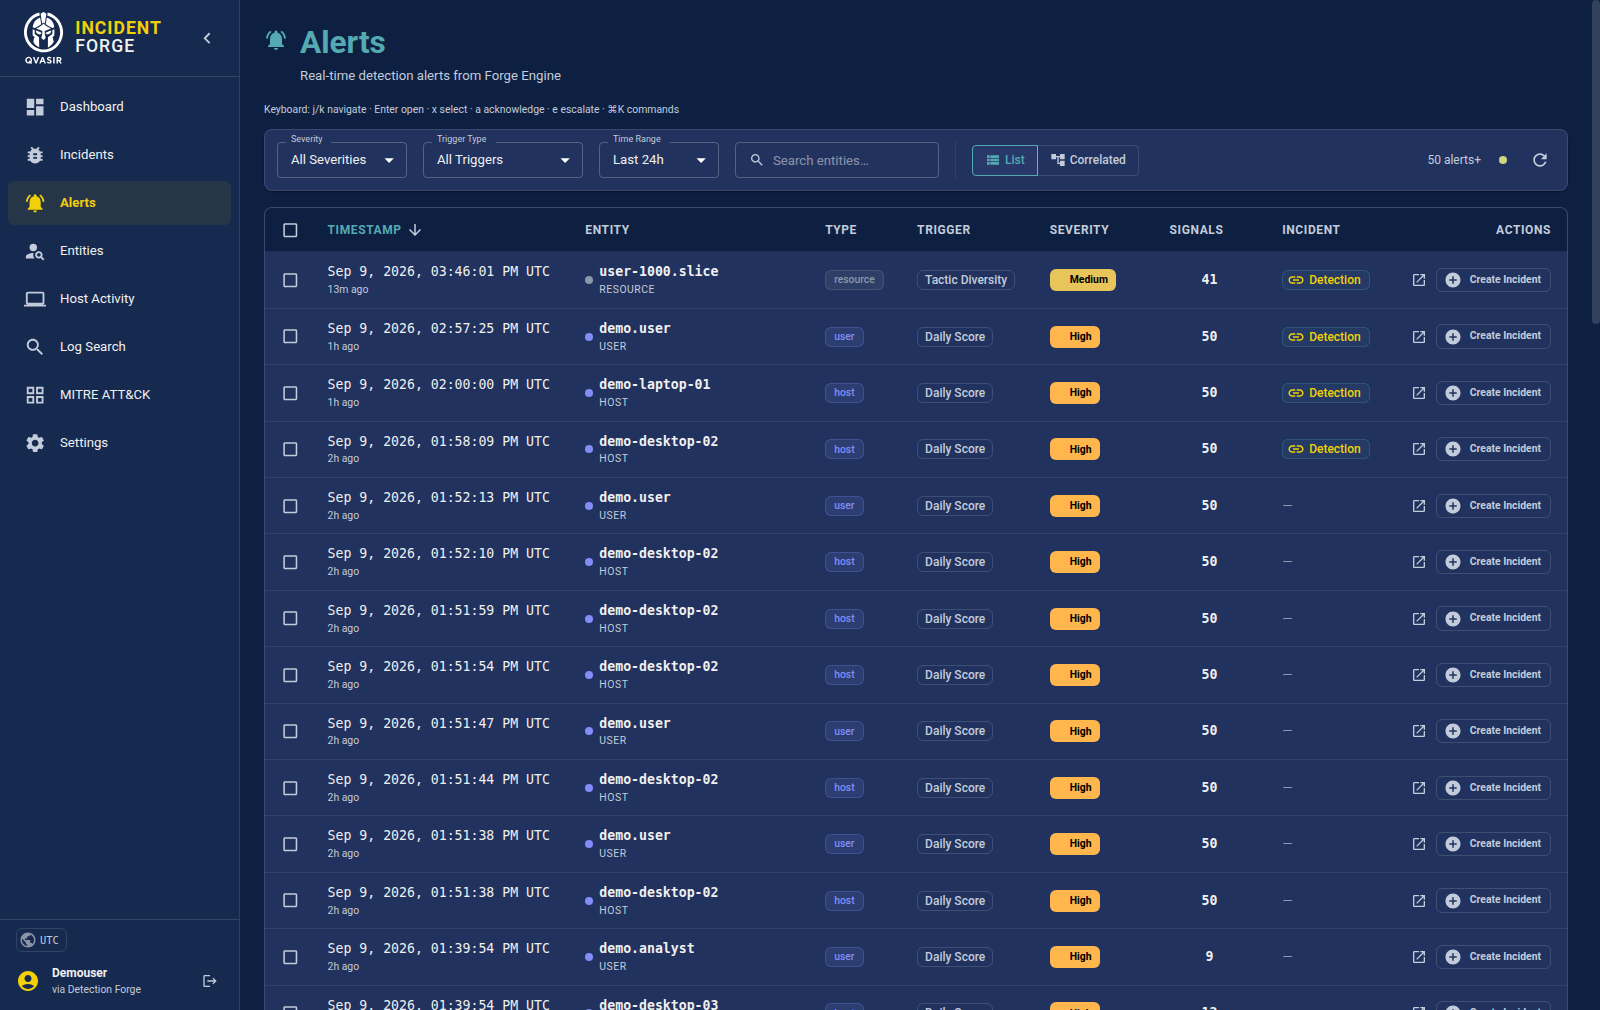
Real-time alerts scored per entity — daily and tactic-diversity scores across users, hosts and resources, each linked to the detection that produced it
Signals scored per entity — daily scores and tactic diversity converge distributed activity into one picture.

Agents with tools — secured like production, because it is production.

Investigation agents use the Model Context Protocol (MCP) to reach the tools an analyst would: threat intelligence, DNS, and your own platform data — and the framework is extensible with custom tools for your environment.

  • Capability scoping per tool — each tool server enforces its own allowlist server-side, so a disabled tool stays unreachable even from a compromised client; scope failures fail closed.
  • No secret sprawl — credentials for external services stay in the platform's controlled tool layer, never in prompts.
  • Everything audited — every tool call, input, and result is logged and reviewable, the same as any other system activity.
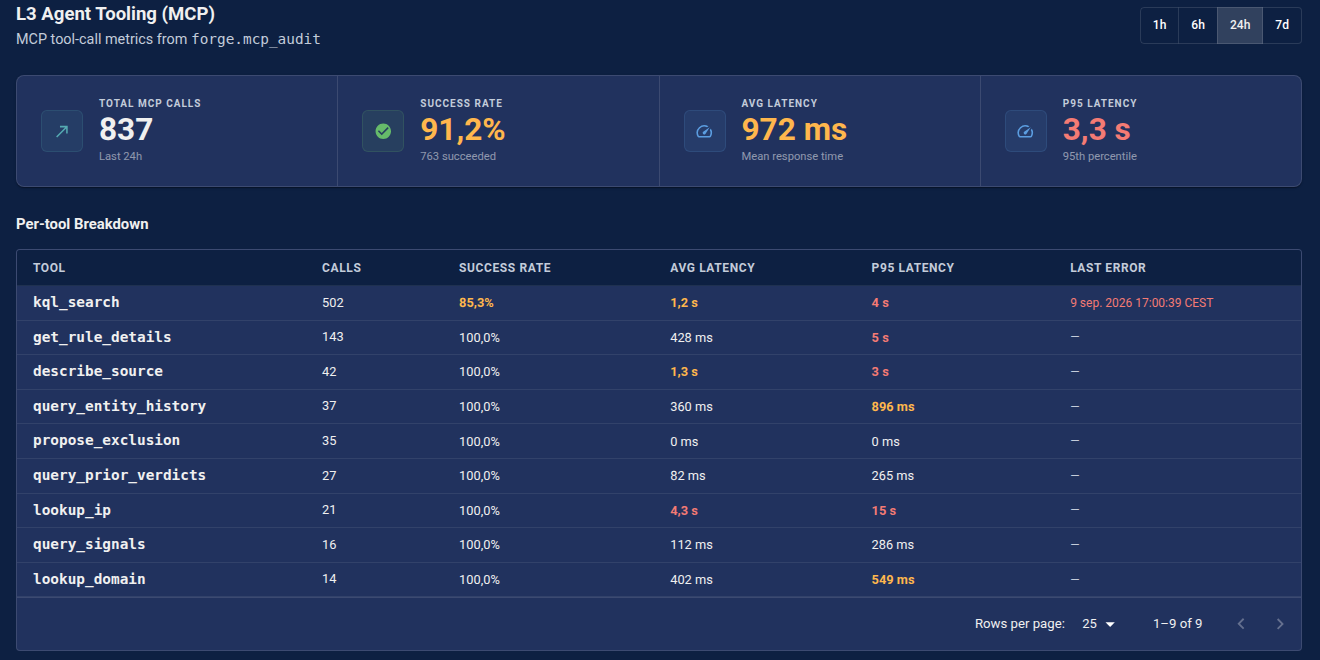
L3 agent tooling panel: 837 MCP tool calls in the last 24 hours at 91.2% success, broken down per tool — kql_search, get_rule_details, describe_source, query_entity_history and five more — each with call count, success rate and latency
Every agent tool call — counted, timed, and on the record.

What it costs to run

Investigation is metered, and it refuses to pay twice.

An AI investigation costs real money per incident, which is the objection nobody in this category answers on their website. Two mechanisms keep that bounded, and both of them exist because the alternative was discovered the expensive way.

A spend budget, checked before each investigation

The platform is asked whether there is budget left before an investigation starts. When it is exhausted, the investigation is skipped rather than quietly running up a bill you find out about at the end of the month.

The same entity is not re-investigated for the same thing

After a verdict, what was concluded about that entity is remembered — the decision, the severity, the tactics. A fresh alert for the same entity that is not a genuine escalation on that picture reuses the verdict instead of paying for a second opinion on the same question.

And still appends to the open incident

Skipping the investigation does not mean producing nothing. A lightweight verdict is still emitted, so the new activity joins the incident already open on that entity — rather than vanishing because it was judged not worth a second look.

The honest dependency. Investigation is the one stage of the pipeline that requires a model — ingest, matching and correlation are all deterministic and run without one, as does search. With no provider configured you still get scored, correlated, entity-aware alerts; what you do not get is the investigated incident this page describes. Provider support here is narrower than elsewhere in the platform: investigation runs on Anthropic or Gemini.

And when a human takes over, the tools are there.

Event search

Fast search across your event store — pivot from any incident entity straight into the events behind it, exactly as the source emitted them.

Analyst workflow

Verdicts, escalation, and case notes are built in — and every analyst verdict feeds the detection improvement loop.

Full audit trail

Every action on an incident — human or AI — is recorded. Handovers, reviews, and post-incident reporting come for free.

Read a full example incident report →

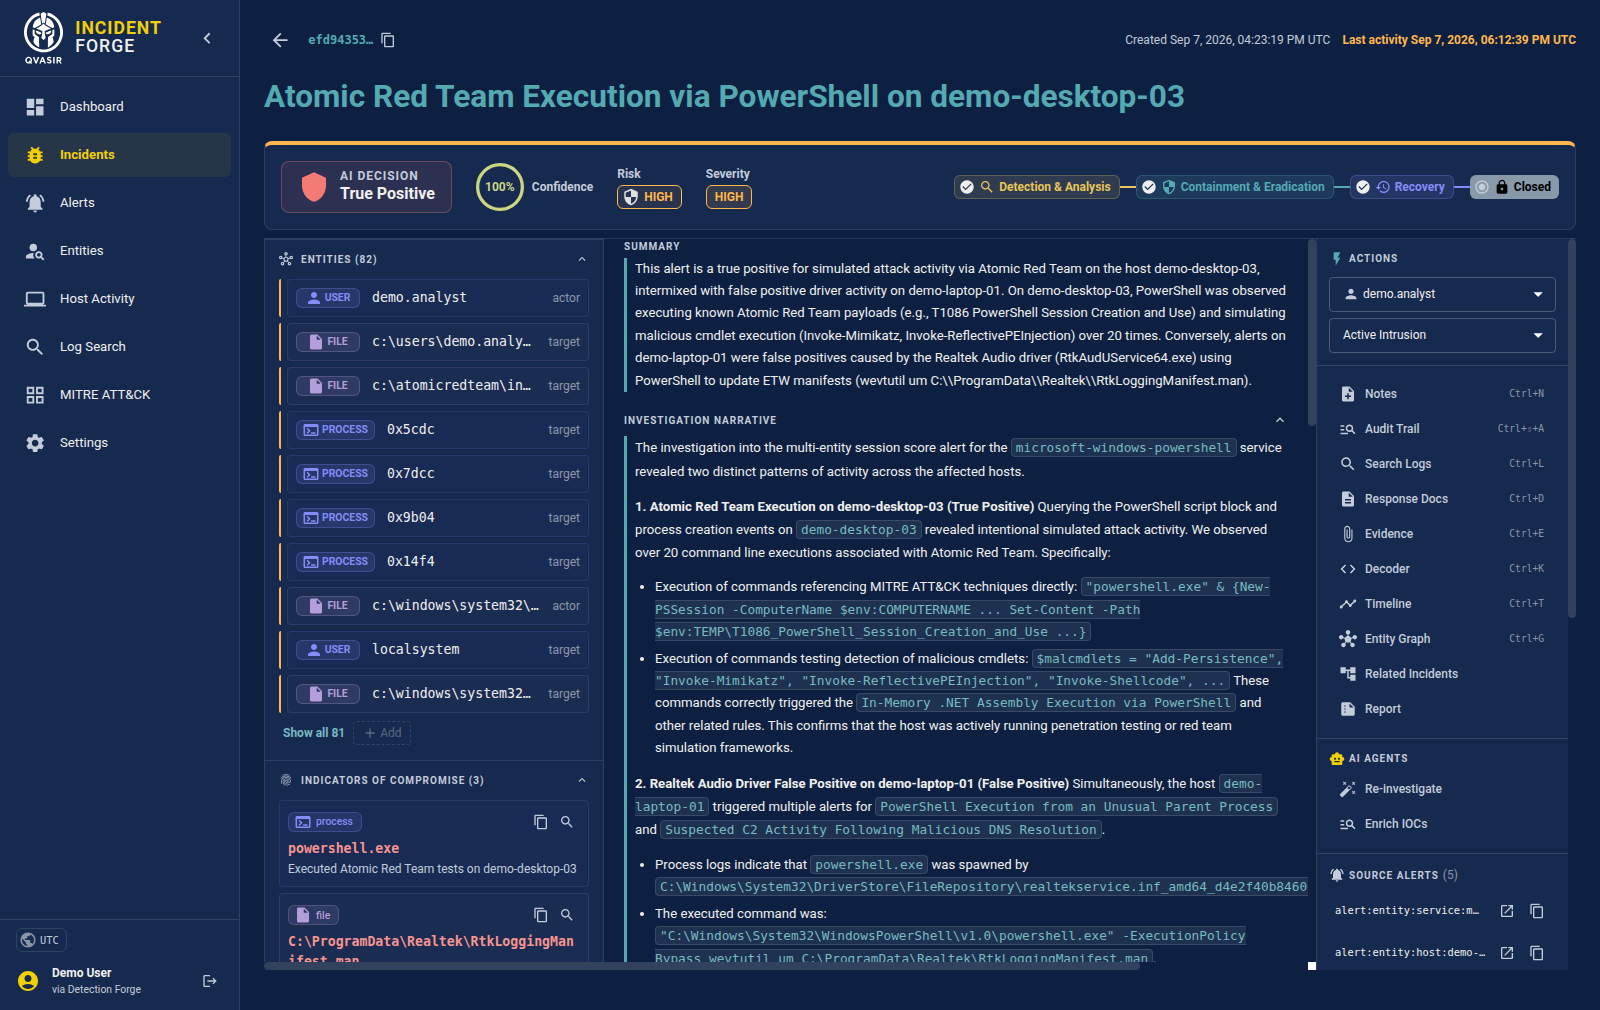
Incident page: AI decision True Positive at 100% confidence, high risk and severity, NIST phases from detection to closed, 82 entities and 3 indicators of compromise, an investigation narrative with evidence, and analyst actions — notes, audit trail, log search, evidence, timeline, entity graph — one keystroke away
What lands in the queue: the decision with its confidence, the narrative with its evidence, every entity and indicator — and the analyst tools one keystroke away.